
wikipedia
The following source code gives a numerical calculation of \[Z(t) \approx 2 \sum_{n=1}^{N}n^{-\frac{1}{2}}\cos [\theta(t) - t\log n] + R,\]
where \[\theta(t) = \Im \log \Gamma (1 + \frac{it}{2}- \frac{3}{4}) - \frac{t}{2}\log\pi . \] This can be simplified to an easily calculatable approximation given by:
\[\theta(t) \approx \frac{t}{2}\log (\frac{t}{2\ pi}) - \frac{t}{2} - \frac{\pi}{8} + \frac{1}{48t }+ \frac{7}{5760t^{3}}.\]
The final term, [\ R,\] in the original sum, is the remainder term, which is complicated to derive but can be reduced to a sum,[
\[ R \approx (-1)^{N-1}(\frac{t}{2 \pi})^{-1/4}[C_{0} + C_{1}(\frac{t}{2 \pi})^{-1/2} +C_{2}(\frac{t}{2 \pi})^{-1} +
C_{3}(\frac{t}{2 \pi})^{-3/2} + C_{4}(\frac{t}{2 \pi})^{-2}].\]
We will use this approximation in the calculation.
NB. Calculation of Z(x), estimate of zeta(x) for x = a +ib where b = 0.5
NB. Riemann-Siegel formula. (from Riemann Zeta Function, H.M Edwards)

load 'plot'
load 'numeric trig'

C0 =: 0.38268343236508977173, 0.43724046807752044936, 0.13237657548034352333, _0.01360502604767418865, _0.01356762197010358088, _0.00162372532314446528, 0.00029705353733379691,0.00007943300879521469, 0.00000046556124614504, _0.00000143272516309551, _0.00000010354847112314, 0.00000001235792708384, 0.00000000178810838577, _0.00000000003391414393, _0.00000000001632663392

C1 =: 0.02682510262837535, _0.01378477342635185, _0.03849125048223508, _0.00987106629906208, 0.00331075976085840, 0.00146478085779542, 0.00001320794062488,_0.00005922748701847, _0.00000598024258537, 0.00000096413224562, 0.00000018334733722

C2 =: 0.005188542830293, 0.000309465838807, _0.011335941078299, 0.002233045741958,0.005196637408862, 0.000343991440762, _0.000591064842747, _0.000102299725479, 0.000020888392217,0.000005927665493, _0.000000164238384, _0.000000151611998

C3 =: 0.0013397160907, _0.0037442151364, 0.0013303178920, 0.0022654660765,_0.0009548499998, _0.0006010038459, 0.0001012885828, 0.0000686573345, _0.0000005985366,_0.0000033316599, _0.0000002191929, 0.0000000789089, 0.0000000094147

C4 =: 0.00046483389, _0.00100566074, 0.00024044856, 0.00102830861,_0.00076578609, _0.00020365286, 0.00023212290, 0.00003260215, _0.00002557905, _0.00000410746,0.00000117812, 0.00000024456

pi2 =: +: o. 1

theta =: 3 : 0
assert. y > 0
p1 =. ( * -:@:^.@:(%&pi2)) y
p2 =. --: y
p3 =. -(o. 1) % 8
p4 =. 1 % (48 * y)
p5 =. 7 % (5760 * y ^ 3)
p1 + p2 + p3 + p4 + p5
)

summation =: 3 : 0 "1

v =. >0{y
m =. >1{y
thetav =. theta v
ms =. >: i. m
cos =. 2&o.
s =. +:@:(^&_0.5) * cos@:(thetav&-@:(v&*@:^.))
+/ s ms
)

remainderterms =: 3 : 0
im =. y
v =. %: pi2 %~ y
N =. <. v
p =. v - N
q =. 1 - 2 * p
final =. 0

mv0 =. +/ (({&C0) * (q&^@:+:)) i. # C0
final =. mv0

mv1 =. +/ (({&C1) * (q&^@:+:@:>:)) i. # C1
mv1 =. mv1 * ((im % pi2) ^ _0.5)
final =. final + mv1

mv2 =. +/ (({&C2) * (q&^@:+:)) i. # C2
mv2 =. mv2 * ((im % pi2) ^ _1)
final =. final + mv2

mv3 =. +/ (({&C3) * (q&^@:+:@:>:)) i. # C3
final =. final + mv3

mv4 =. +/ (({&C4) * (q&^@:+:)) i. # C4
final =. final + mv4


final * (_1 ^ <: N) * ((im % pi2) ^ _0.25)
)


z =: 3 : 0 "0
im =. y
v =. %: pi2 %~ y
N =. <. v
p =. v - N
v1 =. summation im ; N
v2 =. remainderterms im
v1 + v2
)

x =: steps 0.1 100 3500
plot x; z x
Graphical plot
The lines:
 x =: steps 0.1 100 3500
 plot x; z x
create a plot of the function from 0.1 to 100 in 3500 steps, as shown below:
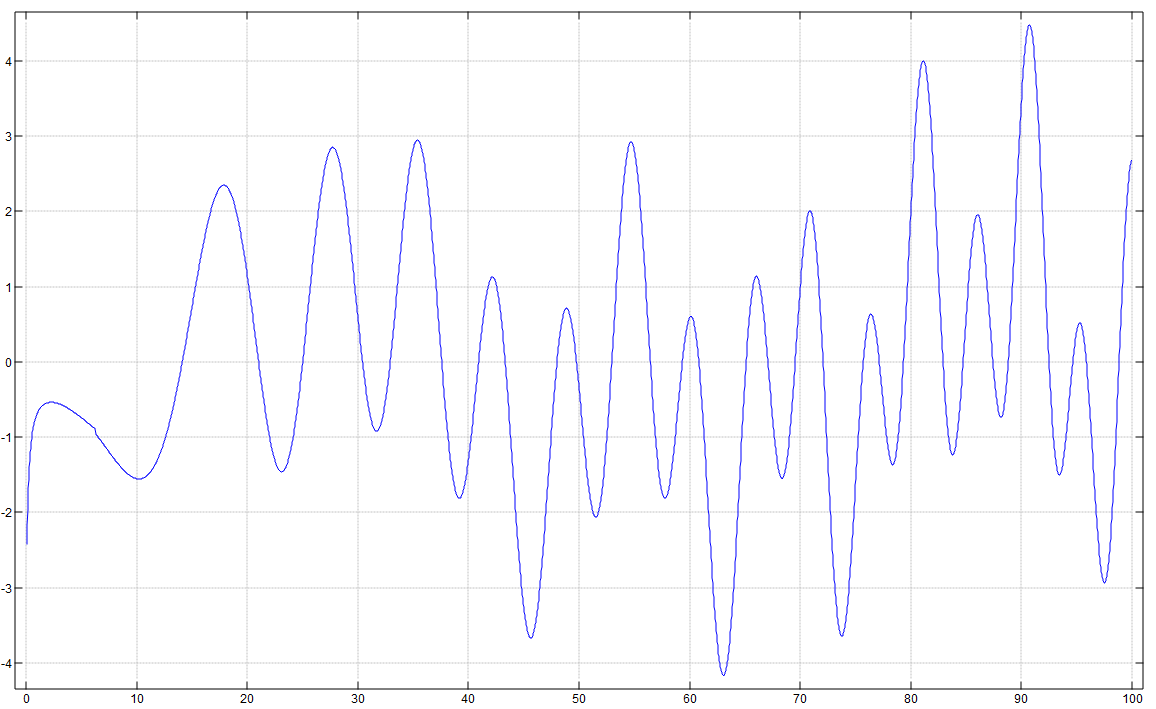
You can see the zeros of the Zeta Function from this graph. The first zero is at about x = 14.29.
Plotting Zeta function on the complex plane
 zeta3d =: 3 : 0
 if. (0{+.y) > 0.5 do.
 I =. >: i. 100
 +/I^-y
 elseif. (0{+.y) < 0.5 do.
 z =. zeta3d 1-y
 g =. ! 1-y
 s =. 1 o. -:(o.1)*y
 c =. ((o.1)^(y-1))*2^y
 r=.z*g*s*c
 if. 40 < |r do.
 r =. 40
 end.
 r
 elseif. 1 do.
 0
 end.
 )

 absz =: |@:zeta3d
 realz=: 0&{@:+.@:zeta3d
 imz=: 1&{@:+.@:zeta3d
 D =.steps _15 15 40
 'surface; viewpoint 1 _1 2' plot imz"0 j./~ D NB. use realz for real graph.
Here is a plot of the imaginary parts:

....and the real parts.
